¶ Machine Learning for Enabling 5G and Satellite Network Coexistence in FR3 Spectrum
WINLAB Summer Internship 2025
Group Members: Audrey Wang, Tulika Punia, Srishti Hazra
¶ Project Overview
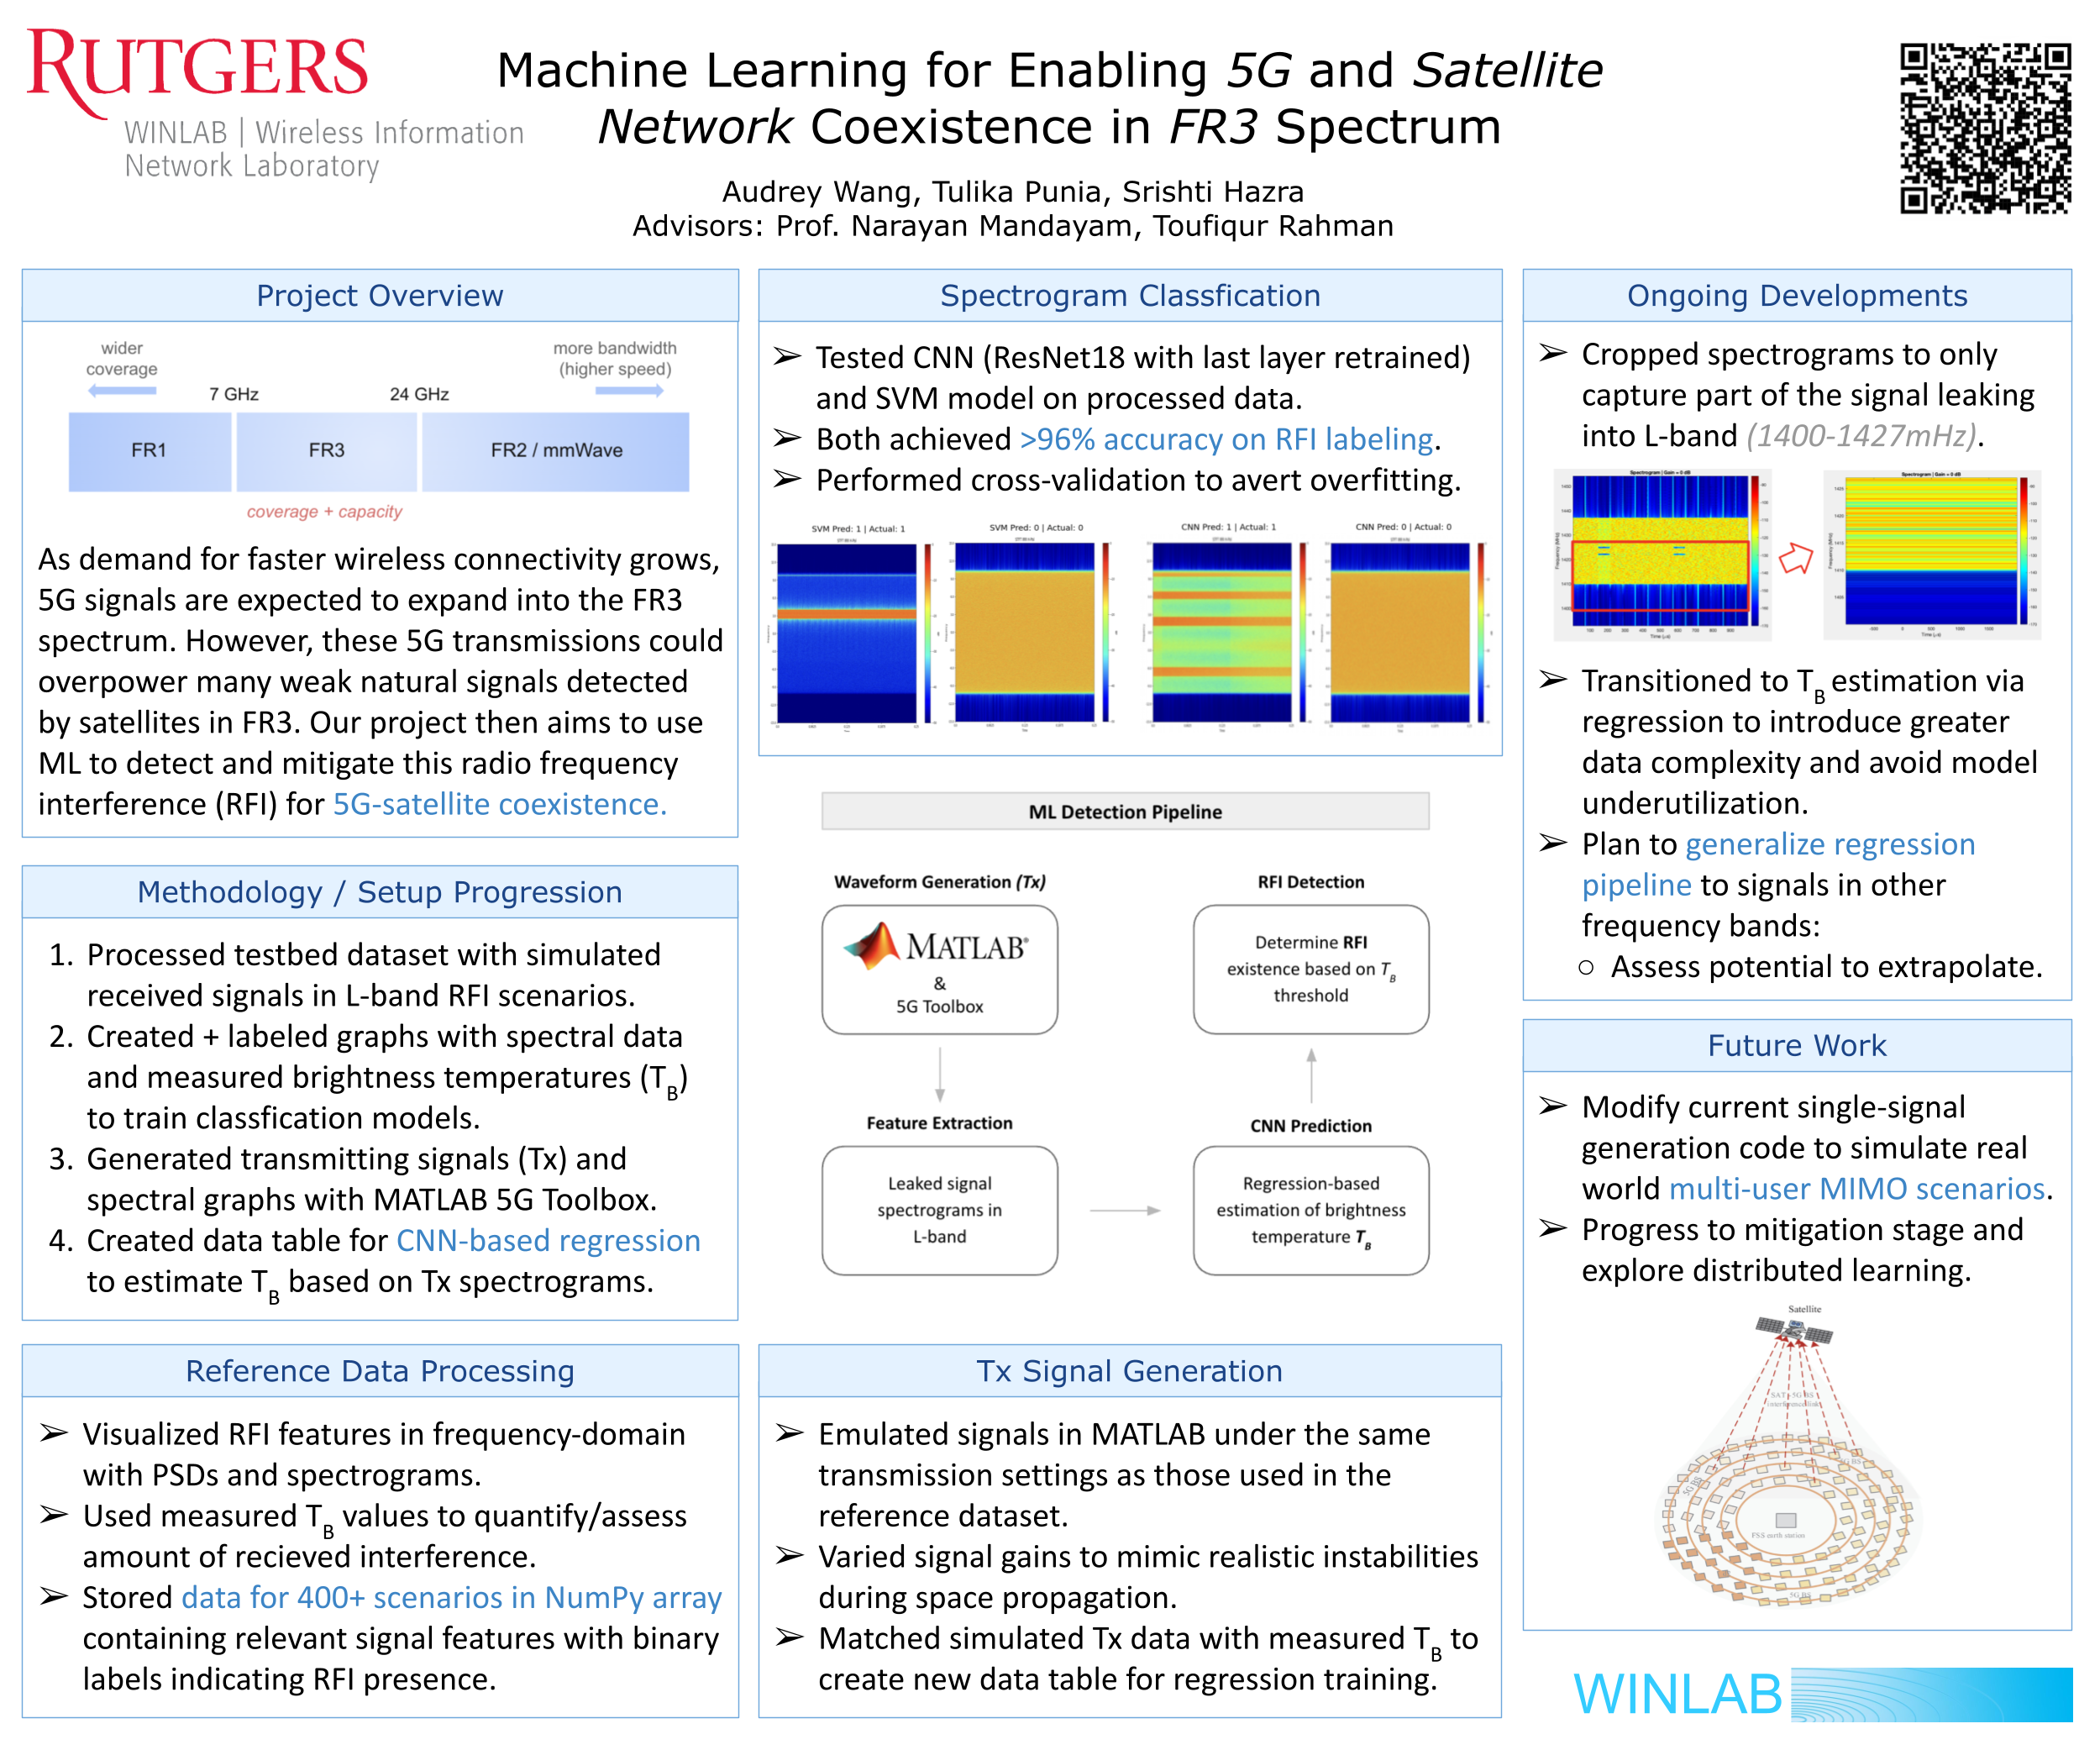
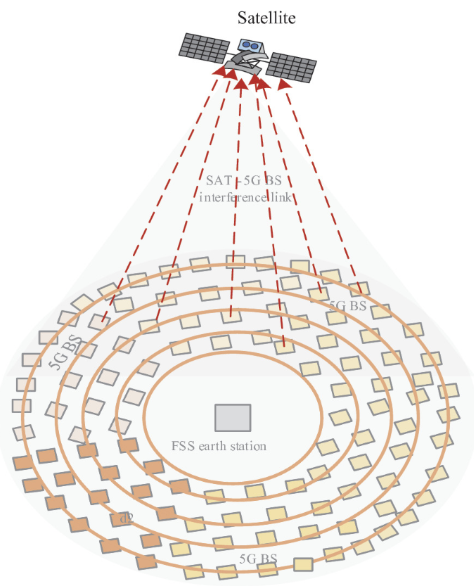
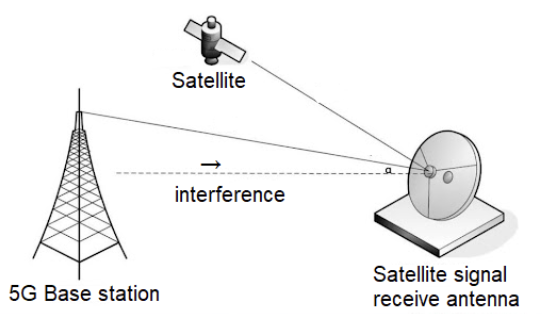
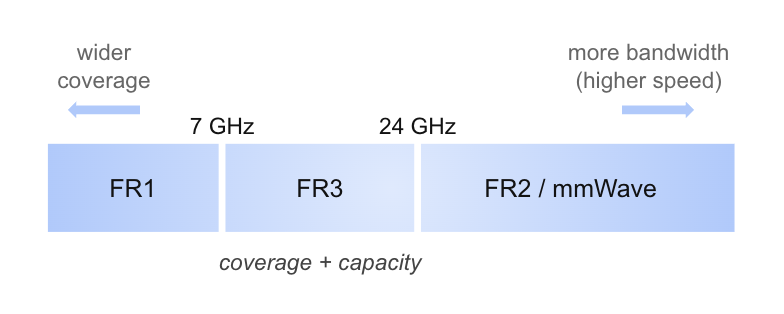
Radio Frequency Interference (RFI) occurs when overlapping signals, such as those from satellite systems and emerging 5G technologies in the FR3 (7–24 GHz) band, disrupt each other’s communication quality. We aim to develop a machine learning pipeline that can detect and mitigate such interference. To detect RFI, we utilize convolutional neural networks that leverage both graphical data generated from existing datasets and custom 5G signal data produced using MATLAB’s 5G Toolbox. For the mitigation aspect, we will apply ML algorithms to optimize beam-forming with real-time data.
¶ Week 1 (5/27 - 5/29):
Slides: Week 1 Presentation
Progress:
- Conducted literature review on relevant research papers
- Modeling the Impact of 5G Leakage on Weather Prediction
- Will Emerging Millimeter-Wave Cellular Networks Cause Harmful Interference to Weather Satellites?
- How Does the Growth of 5G mmWave Deployment Affect the Accuracy of Numerical Weather Forecasting?
- Understood the high level idea of what Radio Frequency Interference(RFI) and frequency allocations are
- Explored how ML can be implemented to minimize the interference between satellite and 5G in different spectrums
¶ Week 2 (6/2 - 6/5):
Slides: Week 2 Presentation
Progress:
- Familiar with the pros and cons of the different approaches to beam-forming, especially the benefits of ML application
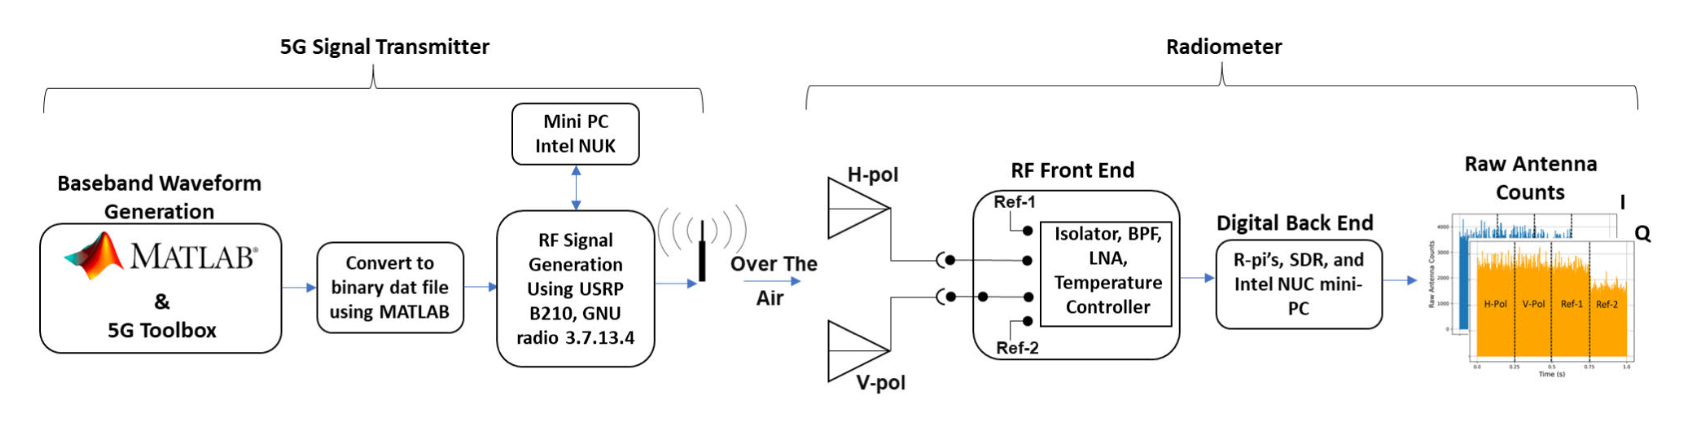
- Read research papers related to a physical-testbed-generated RFI dataset, and got familiar with the data generation process:
- A Physical Testbed and Open Dataset for Passive Sensing and Wireless Communication Spectrum Coexistence
- Microwave Radiometer Calibration Using Deep Learning With Reduced Reference Information and 2-D Spectral Features
- Radio Frequency Interference Detection for SMAP Radiometer Using Convolutional Neural Networks
¶ Week 3 (6/9 - 6/12):
Slides: Week 3 Presentation
Progress:
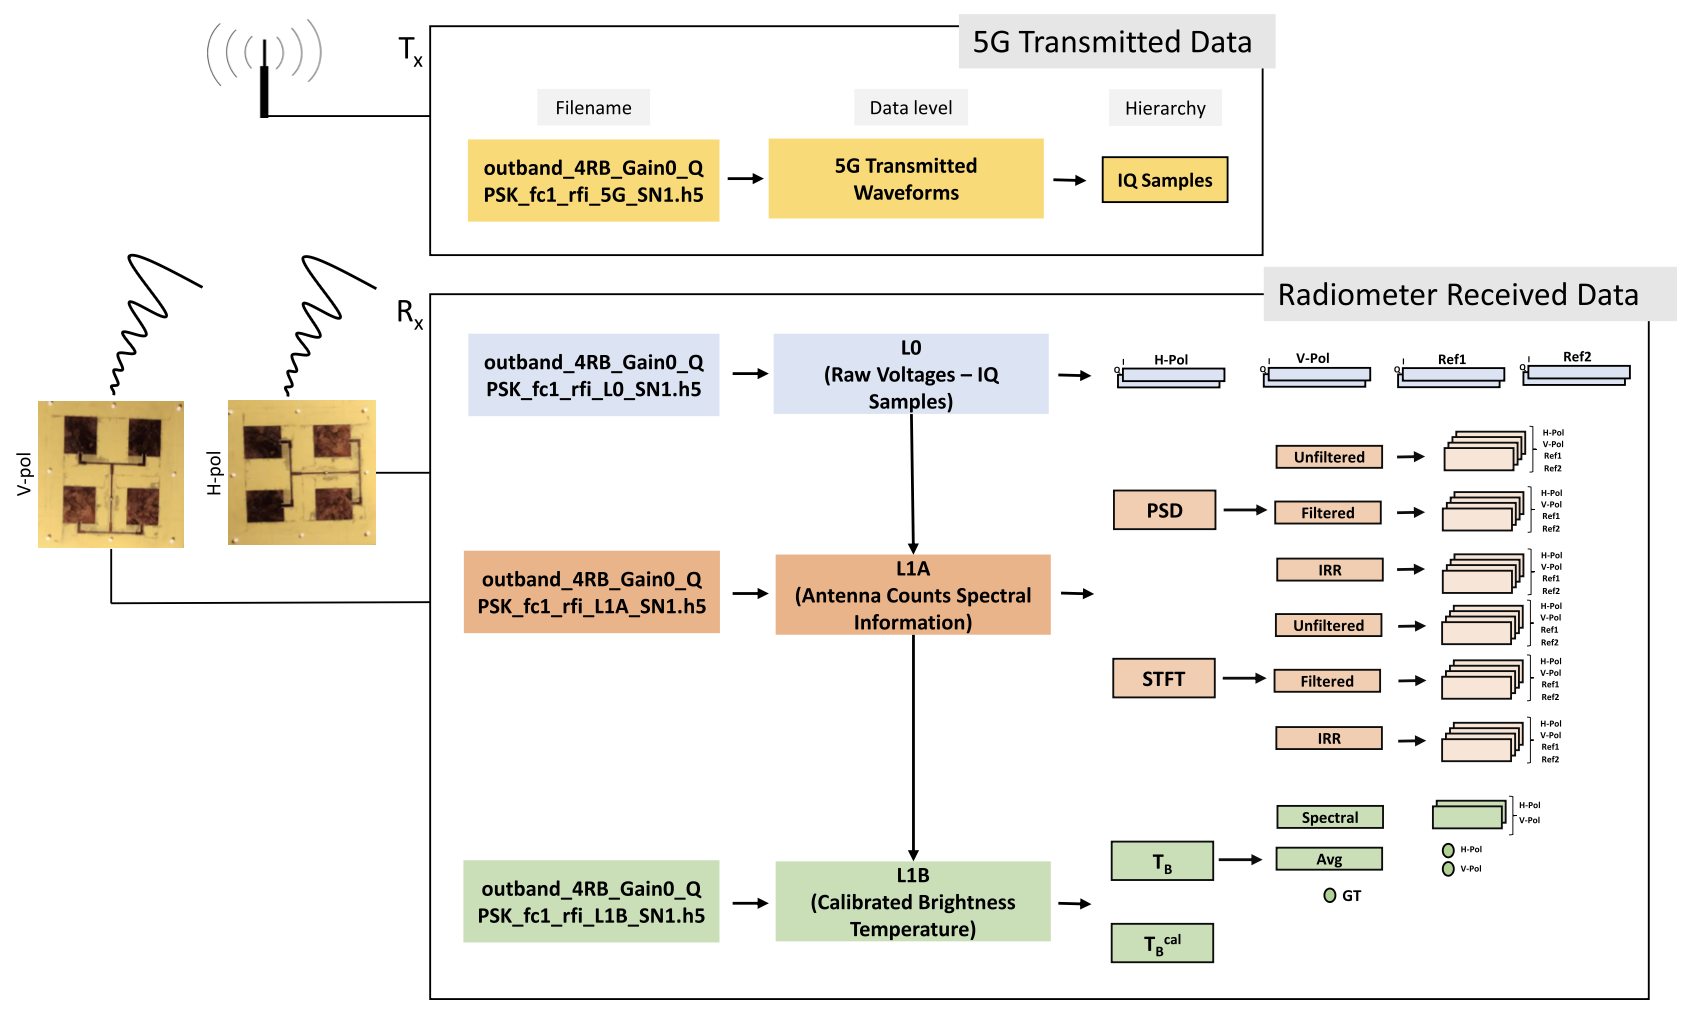
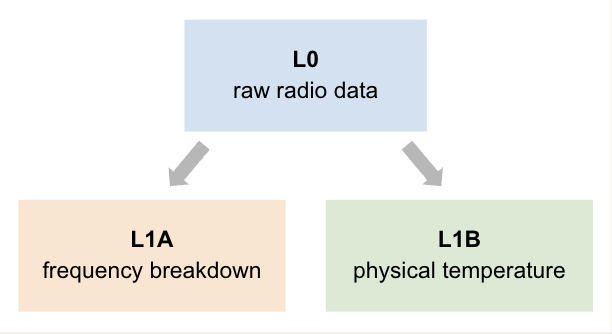
- Grasped the comprehensive testbed pipeline and understood how calibrated higher-level data were obtained from raw I/Q signals
- Began to process data with Numpy and h5py, generating Power Spectral Density(PSD) graphs and spectrograms from L1A data
- Utilized the radiometer's ability to interpret all received power as thermal radiation to quantify RFI by detecting abnormal temperature increases
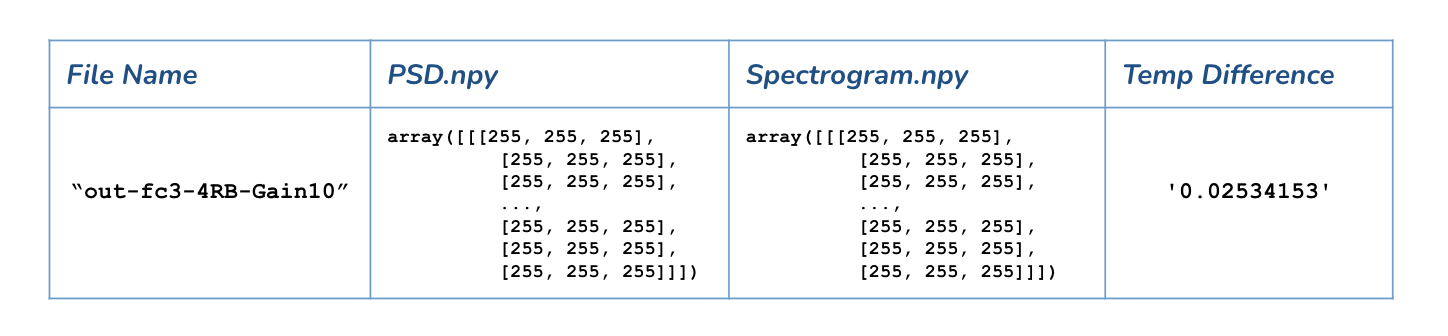
- Saved plotted graphs into a 2D Numpy array for future model training use (4 columns: RFI Scenario | PSD | Spectrogram | Temp Difference)
¶ Week 4 (6/16 - 6/19):
Slides: Week 4 Presentation
Progress:
- Continued generating PSDs and spectrograms using Jupyter Notebook
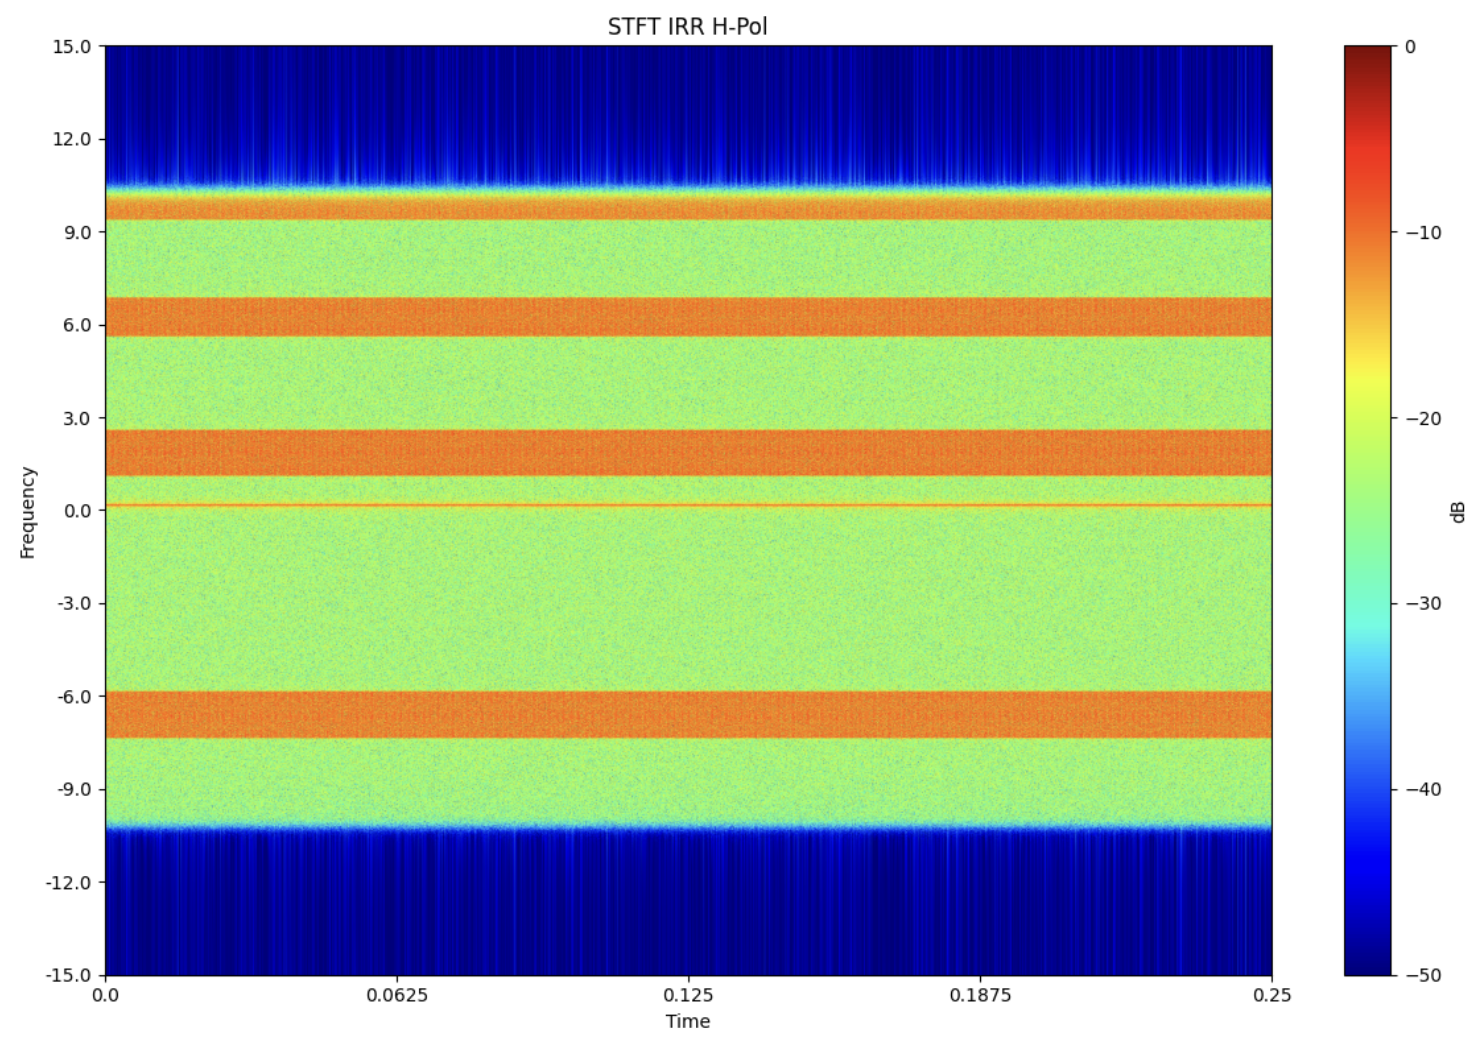
 - Sample PSD and spectrogram for RFI scenario "tr_fc0_4RB_Gain-20_sn2" (transition band; central frequency 0; 4 resource blocks; gain -20; sample number 2)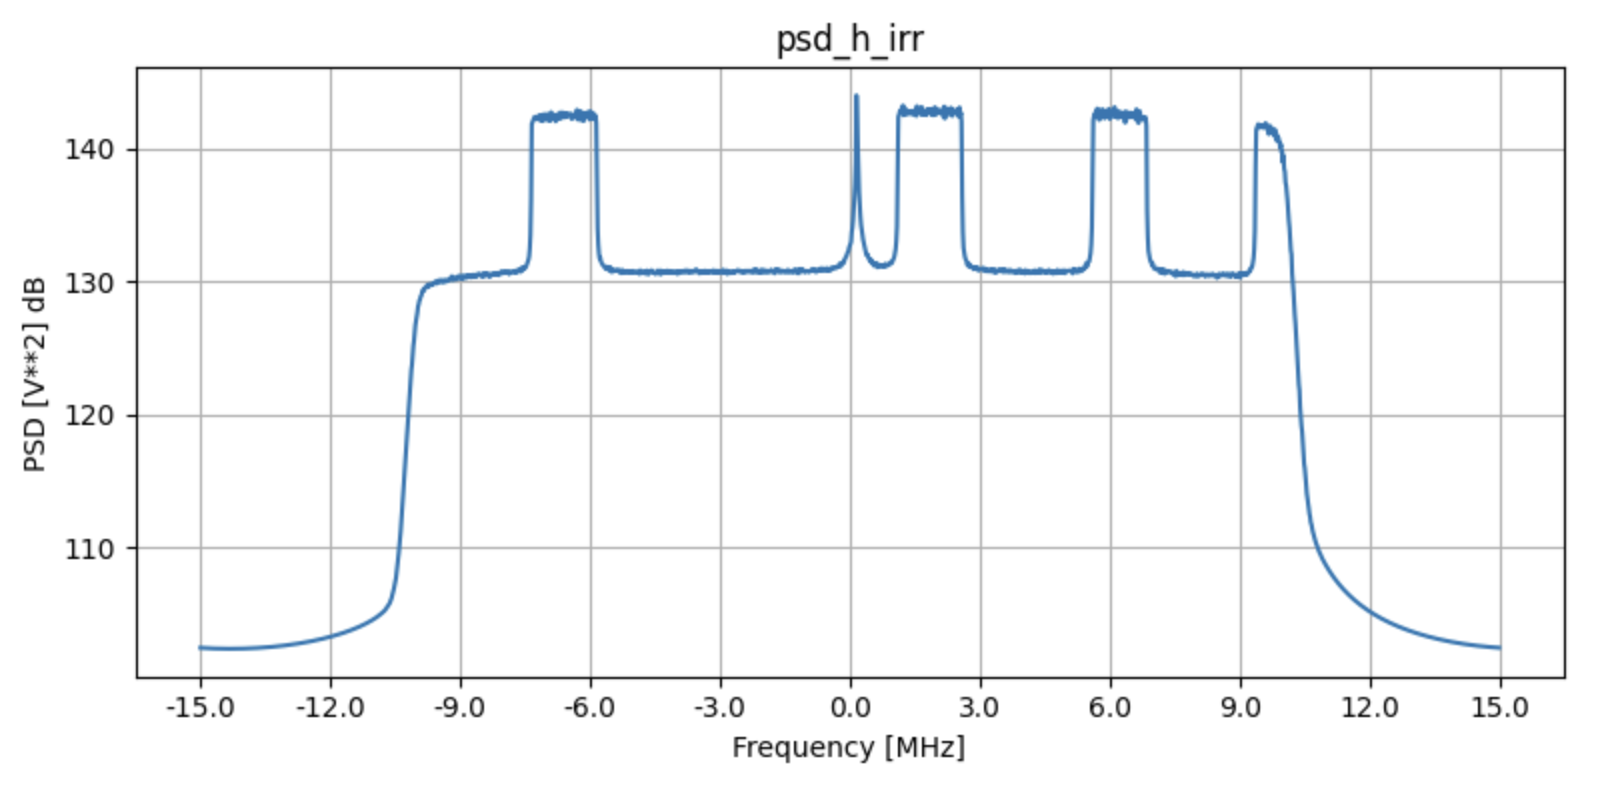
¶ Week 5 (6/23 - 6/26):
Slides: Week 5 Presentation
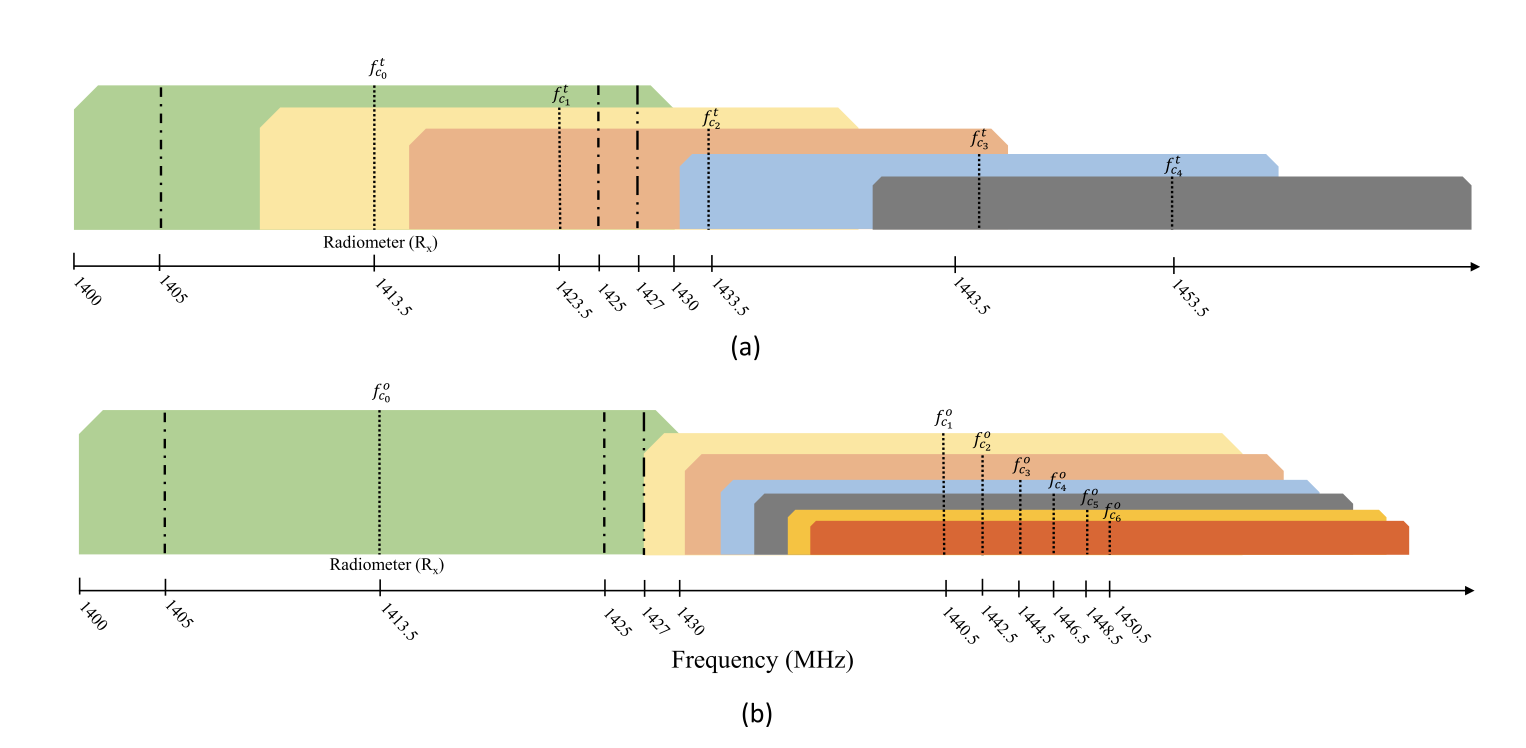
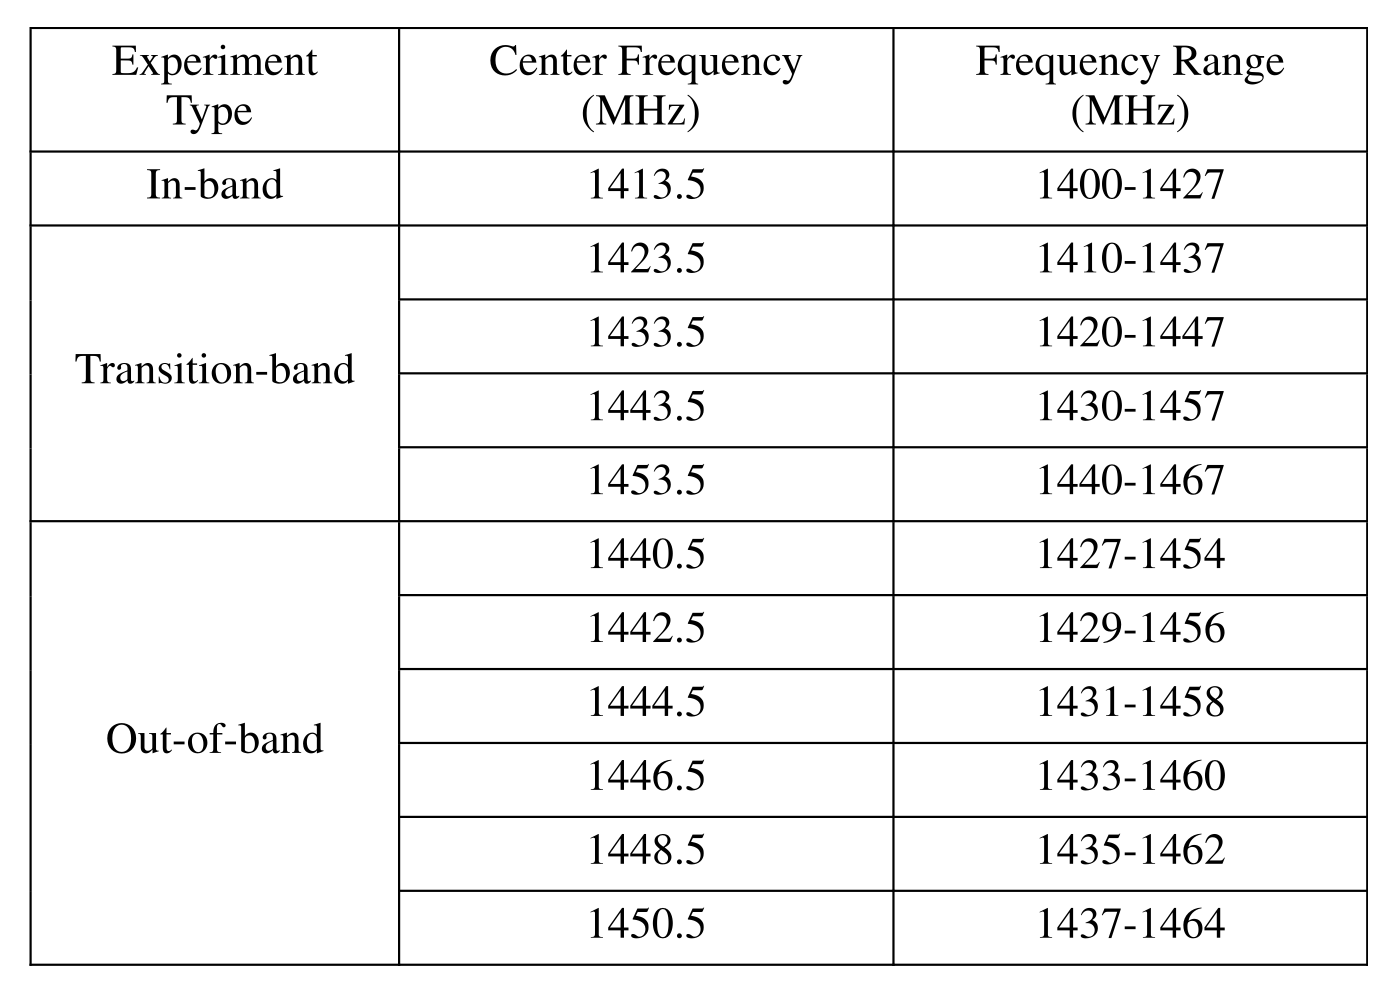
- In progress to generate all graphs for fc1, 2, 3 for both a) transition-band and b) out-of-band scenarios
- Code used for generating spectrograms and converting into Numpy arrays to facilitate easier data processing in the future:
def plot_spect(dataset, title,min_value,max_value,normalized=False, save=None):
    if normalized:
        global_maximum = np.amax(np.abs(dataset))
    else:
        global_maximum = 1

    #normalize received power and convert into dB scale)
    y_res = 20 * np.log10(np.abs(dataset) / global_maximum)

    fig = plt.figure(figsize=(12, 8))
    im = plt.imshow(y_res, origin='lower', cmap='jet', aspect='auto', vmax=max_value, vmin=min_value)
    plt.colorbar(label='dB')

    yaxis = np.ceil(np.linspace(-15, 15, 11))
    ylabel = np.linspace(0, len(y_res), 11)
    xaxis = np.linspace(0, .25, 5)
    xlabel = np.linspace(0, len(y_res[1]), 5)

    plt.title(title)
    plt.yticks(ylabel, yaxis)
    plt.xticks(xlabel, xaxis)
    plt.xlabel('Time')
    plt.ylabel('Frequency')
    plt.tight_layout()

    #save the RGB values of the plot as a Numpy array
    fig.canvas.draw()
    img_rgba = np.frombuffer(fig.canvas.tostring_argb(), dtype=np.uint8)
    img_rgba = img_rgba.reshape(fig.canvas.get_width_height()[::-1] + (4,))
    img_rgb = img_rgba[:, :, [1, 2, 3]]

    return img_rgb
¶ Week 6 (6/30 - 7/3):
Slides: Week 6 Presentation
- Finished generating 348 sets of graphical data for the following inference scenarios:
- Center frequencies 1423.5mHz(fc1), 1433.5mHz(fc2), 1443.5mHz(fc3) for transition band
- Center frequencies 1440.5mHz(fc1), 1442.5mHz(fc2), 1444.5mHz(fc3) for out-of-band
 - Identified clean vs. RFI-contaminated signal shapes in Power Spectral Density (PSD) plots: 1. Uniform (Clean, L): flat-top spectrum, power emitted uniformly across entire bandwidth 2. Spikes (RFI, R): abrupt, sharp spikes in power at random frequencies
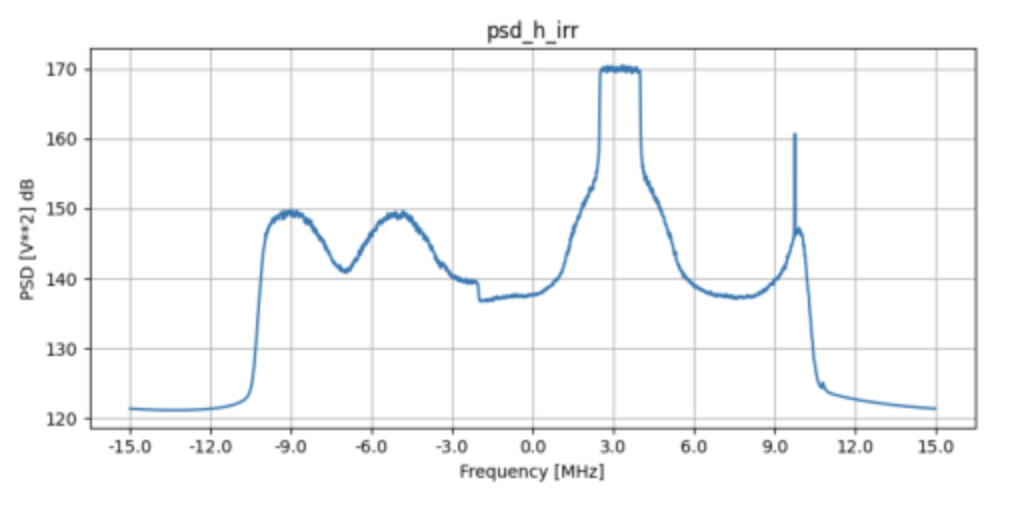
- Determined brightness temperature thresholds for various gain levels and labeled the dataset as clean = 0 or RFI-contaminated = 1
¶ Week 7 (7/7 - 7/10):
Slides: Week 7 Presentation
Progress:
- Machine learning models:
- Trained a CNN for RFI detection using pre-trained model (ResNet18) with the last classification layer modified
- Developed an SVM baseline to assess the efficiency of the CNN approach (address potential underutilization of the neural network)
- Performed cross-validation to ensure the models were not overfitting
- Both the CNN and SVM achieved over 95% accuracy, correctly labeling each graph as either 0 = clean or 1 = RFI
- Performed cross-validation to ensure the models were not overfitting
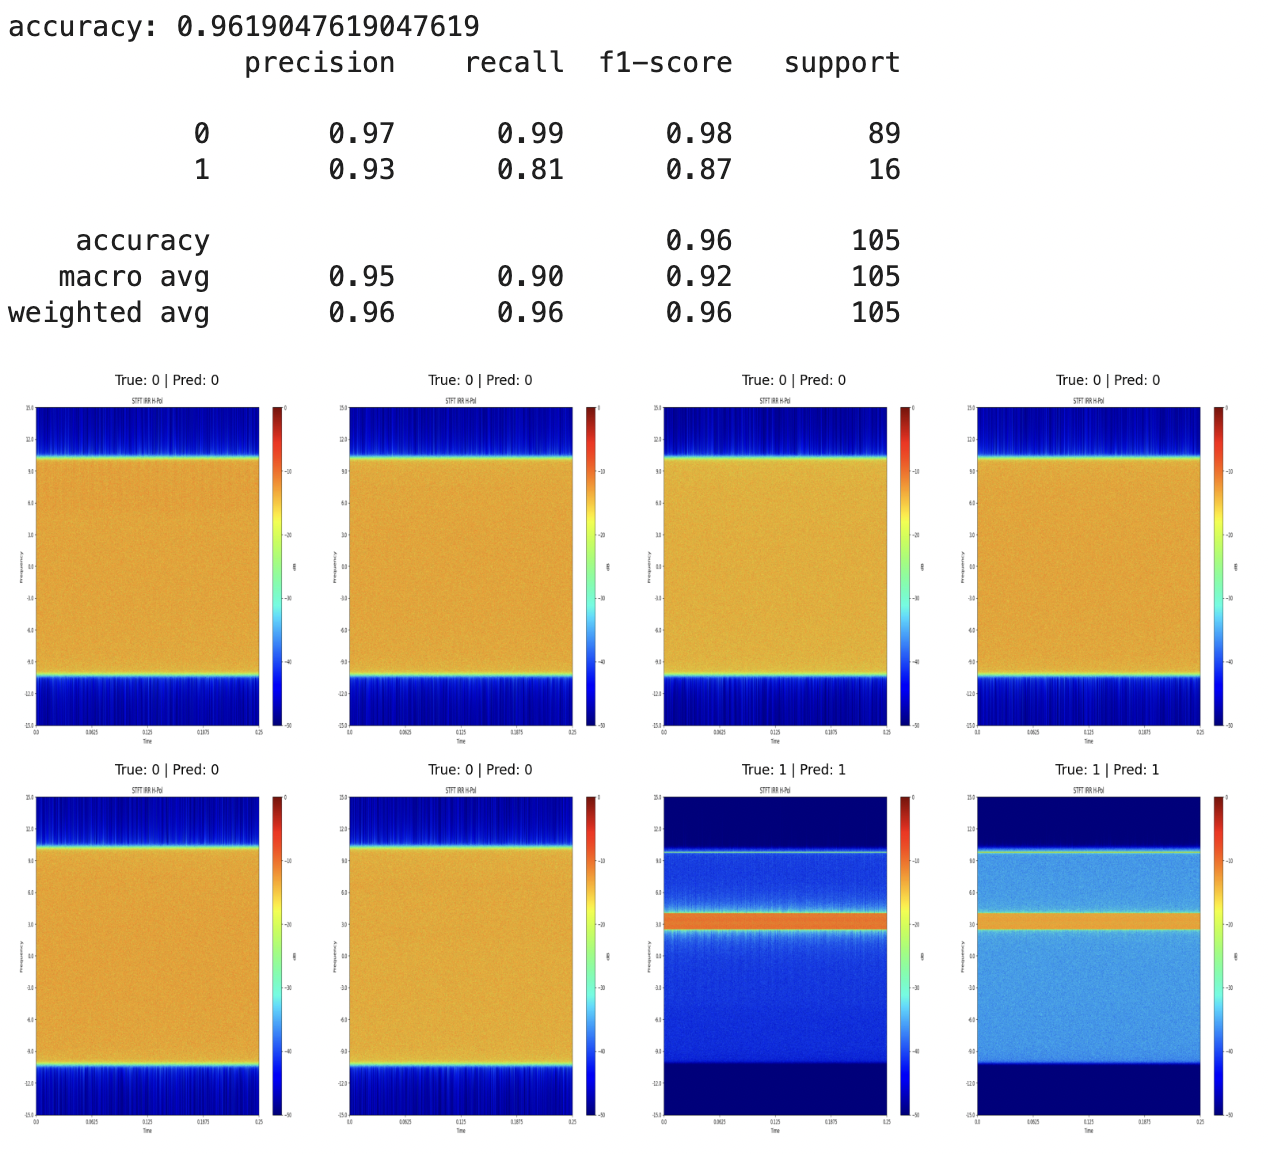
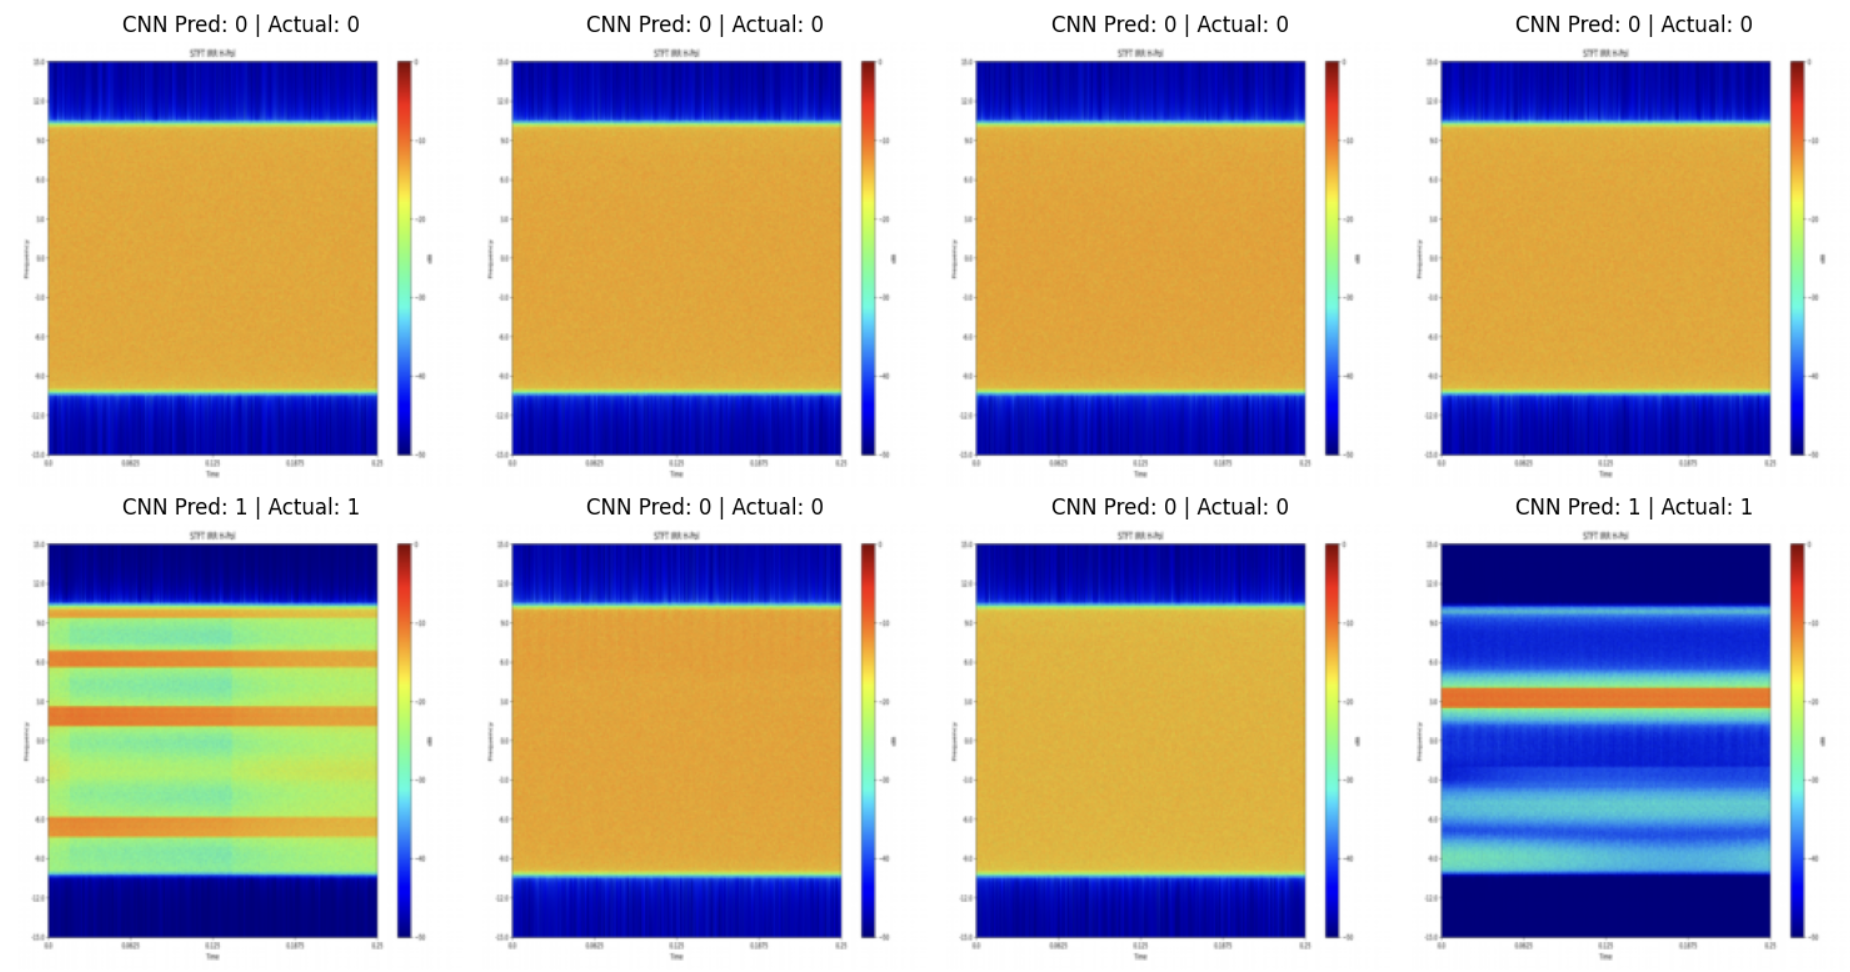
- Continued obtaining data from transition band (100 additional rows: 1413.5mHz(fc0), 1453.5mHz(fc4)
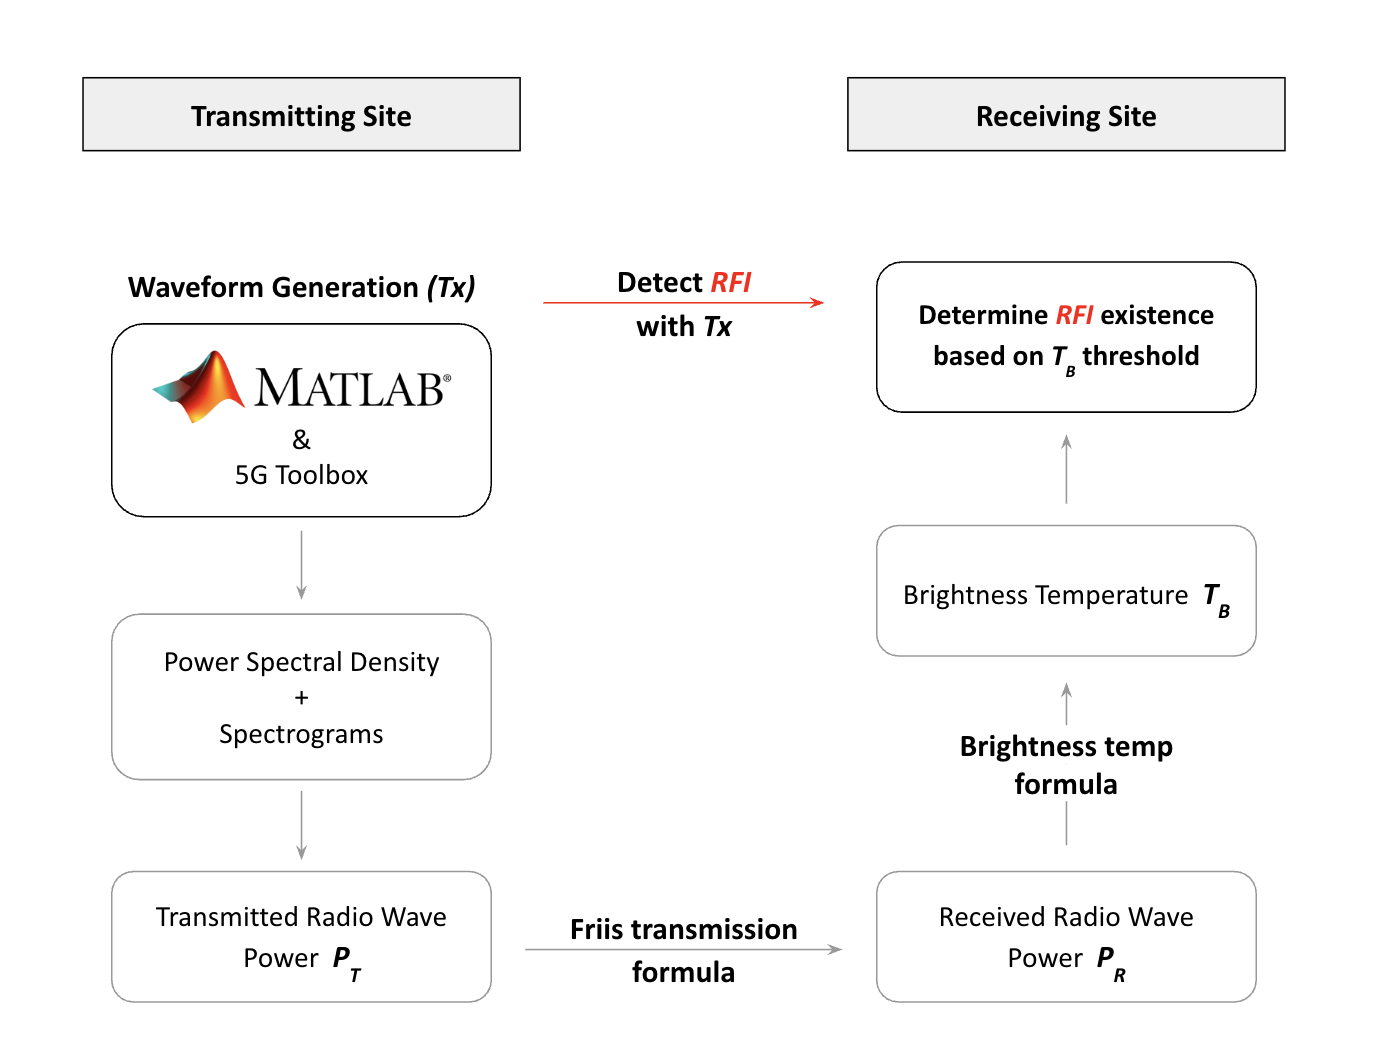
- Created a mathematical pipeline to estimate brightness temperature(K) based on total transmitting power(W)
-
Approximate amount of received power from total transmitted power using Friis Transmission formula
-
Use power recieved to estimate change in brightness temperature cause by RFI
¶ Week 8 (7/14 - 7/17):
Progress:
- Tested the accuracy of the two formulas for estimating brightness temperature by comparing the calculated values with the physically measured Tb values provided in the testbed dataset
- Problem: the calculated Tb only matches the measured Tb when the variables are adjusted to reflect real-life scenarios (e.g., setting the distance between the transmitter and the radiometer to 800 km instead of the testbed value of 5 m)
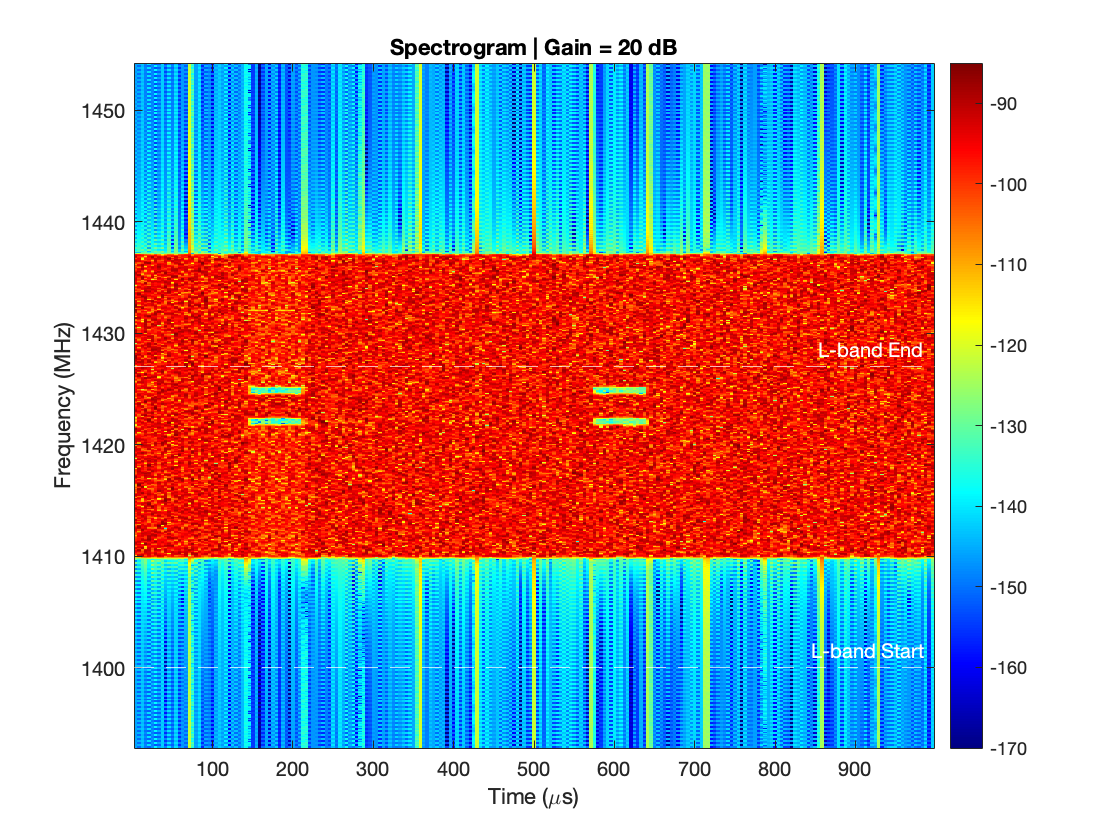
- Generated spectrograms of the transmitted signals using MATLAB's 5G Toolbox, replicating the exact transmission settings described in the referenced research paper
- Centered the graphs around the transmitted central frequency values on the y-axis, and marked the L-band range with blue dashed lines

¶ Week 9 (7/21 - 7/24):
Slides: Week 9 Presentation
Progress:
- Problem: found impracticality in using binary classification (with/without RFI) on transmitting signal spectrograms. As they are pre-RFI and contain no features that reveal the impact of signal interference, Tx graphs are not suitable as input for training CNN, since the model would become a simple color detector (hue of spectrograms based on intensity of power, e.g., orange = RFI, blue = no RFI), which reduces the entire purpose of using ML for RFI detection
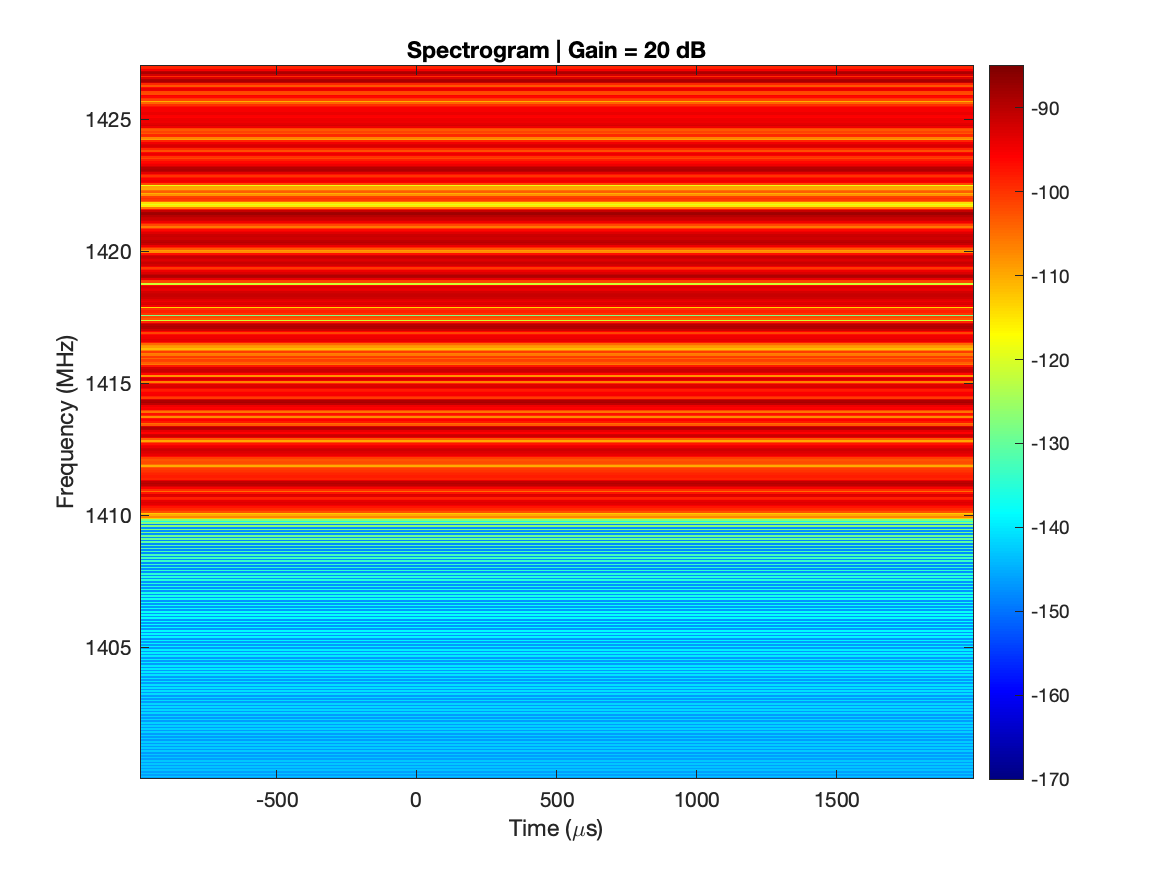
- Solution: pivoted to using cropped Tx spectrograms (only signals leaked into L-band) to estimate brightness temperature, and changed the model from classification to regression
- Force the model to extract more graphical features than just color (ex. using the area of the brighter color in graphs to approximate total Tb when leaked signal reaches the receiving site)
- MATLAB code modification:
- Added a variability margin to the signal gains to simulate the uncertainty in physical transmissions and obtain multiple samples from a single scenario
- Edited the y-axis (frequency range: 1400 MHz–1427 MHz) to illustrate only the section of signals that leaked into the L-band, in order to prevent the CNN model from picking up insignificant details during training (L: original; R: cropped)
¶ Week 10 & 11 (7/28 - 7/31, 8/4 - 8/7):
Slides: Final Presentation
Progress:
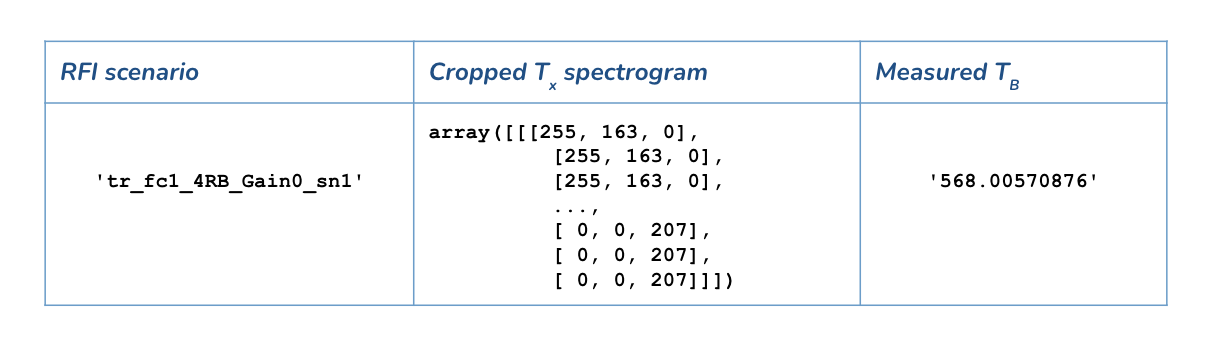
- Created new numpy data table for regression model training:
- 3 columns: RFI Scenario | Transmitting Signal Spectrogram | Brightness Temperature
- Since Tb values of all samples from a single RFI scenario (band, fc, rb, gain) are uniformly distributed, we ordered the Tb values obtained from the reference testbed L1B data from lowest to highest, and matched them with the 10 spectrograms generated with different marginalized signal gain values (uniform from -0.276 to +0.317) that simulate variation in physical transmission
- With this method, we are able to obtain more data points to train and test the CNN, instead of using the exact gain values (-20, -10, 0, 10, 20) to form only one sample per scenario, leaving SN2 to SN10 from the L1B data unused
Final Week:
- Reduced spectrogram resolution to shorten regression model training time and prevent overloading of RAM
-
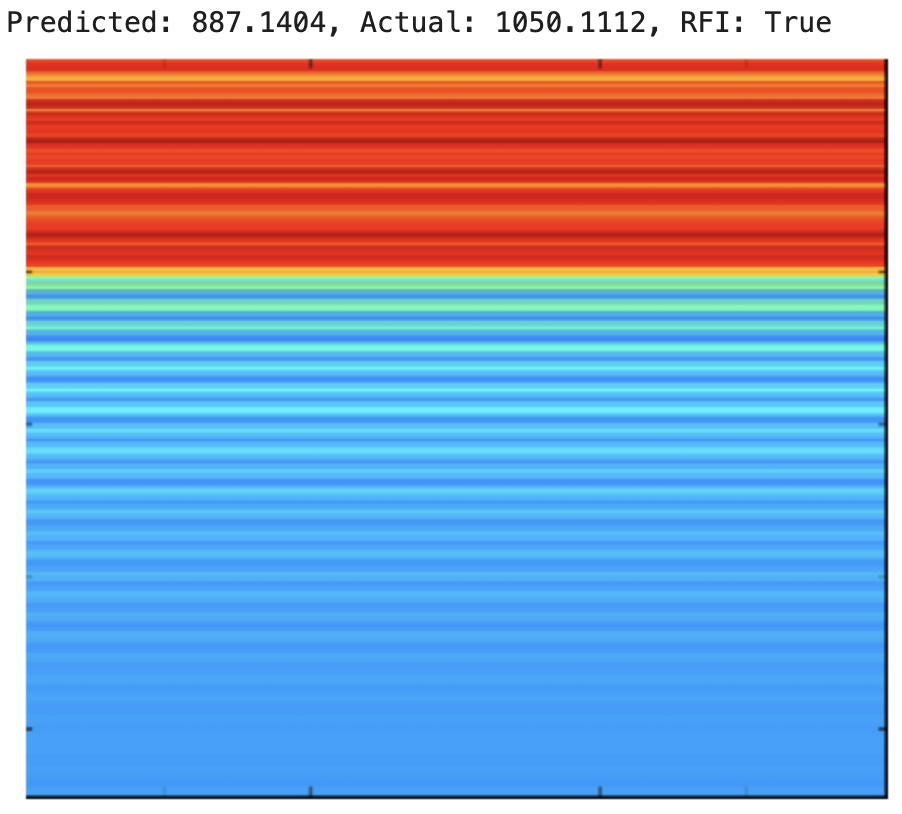
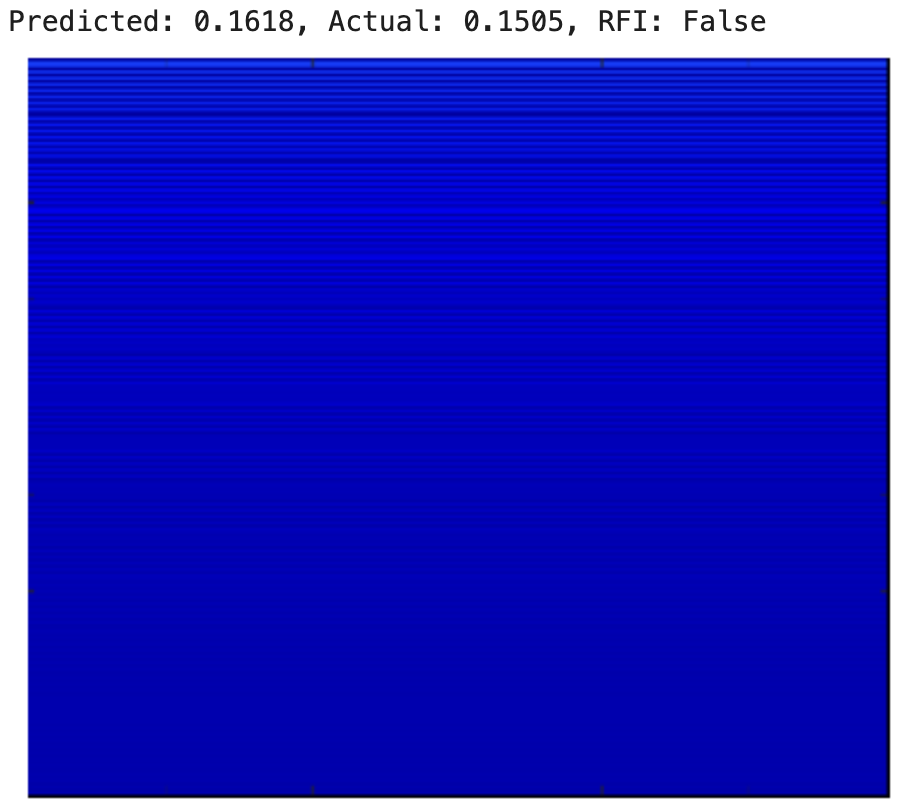
Developed a basic CNN to estimate brightness temperature
-
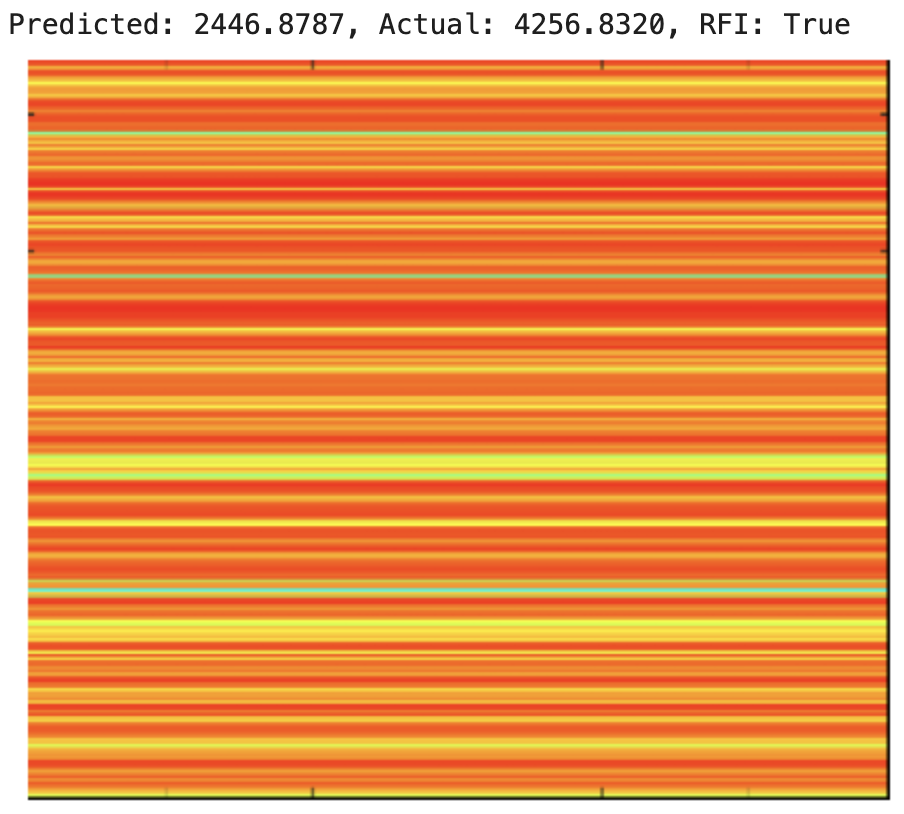
Since the Tb values in the new data table are skewed toward the lower end and there is less representation of high RFI, the prediction errors are higher in more intense RFI scenarios. Additionally, the predicted Tb values for most of the clean spectrograms (those with Tb < 5 K) tend to converge to the same value
-
However, for the purposes of our project, we plan to use a constant Tb threshold of approximately 10 K to assess the presence of RFI. Therefore, errors in the higher Tb range can be considered negligible
Project Poster:
- Future work:
-
Extend current single-signal generation code to multi-user MIMO scenarios to replicate interference patterns seen in the real-world, with many base stations operating simultaneously (constructive & destructive interferences of signals)
-
Explore distributed learning where each 5G BS independently adjusts its signals, eliminating the need for centralized computation